Want to Miss the Market’s 10 Best Days?

Editor's note: This article is public for paid and free subscribers.
10 Best Days Common Theme
Consider for a moment; if I asked you "Would you like to have missed the stock market's 10 best days of the last 20 years with your investments?" What would you say? I think most everyone would say "No, of course not!" Hold that thought.
Let’s visit a common theme you may have heard concerning stock market investing, especially if you mention to market knowledgeable investors that you are dedicating some of your portfolio to trend following or market timing, a tactical asset allocation (TAA) investing strategy. The theme goes something like this - “Stay fully invested! What if you missed the stock market's 10 best days during the last 20 (or 30, 50, 100, etc.) years?”
Search for “10 best days in stock market” and you will easily find many related articles. Most of these articles assert that you MUST remain invested at all times or you risk missing the 10 best days. The articles go on to say that if you were invested during a 20 year (or other significantly long) period, you would have millions of dollars (maybe I'm exaggerating, but you understand), however, you would have very little if you missed the 10 best days.
Most of these articles' conclusion: Don’t attempt to time the market! Period!
I’ve researched these articles at length and the numbers they present are accurate. Unfortunately, they lack context and some rational thought.
10 Best Days Context
Something not usually mentioned in the "10 best days" articles is that the market's best days are usually clustered in with the market’s worst days. Some of the people repeating the recommendation to never attempt market timing may not be aware of the clustering of large up days with large down days. Most of those days occur due to increased volatility during times of market stress.
Take a look at this chart listing the 20 best and worst days of the stock market going back nearly a century. These days are based on the Dow Jones Industrial Average (DJIA), which is a much older index than the S&P 500 index.
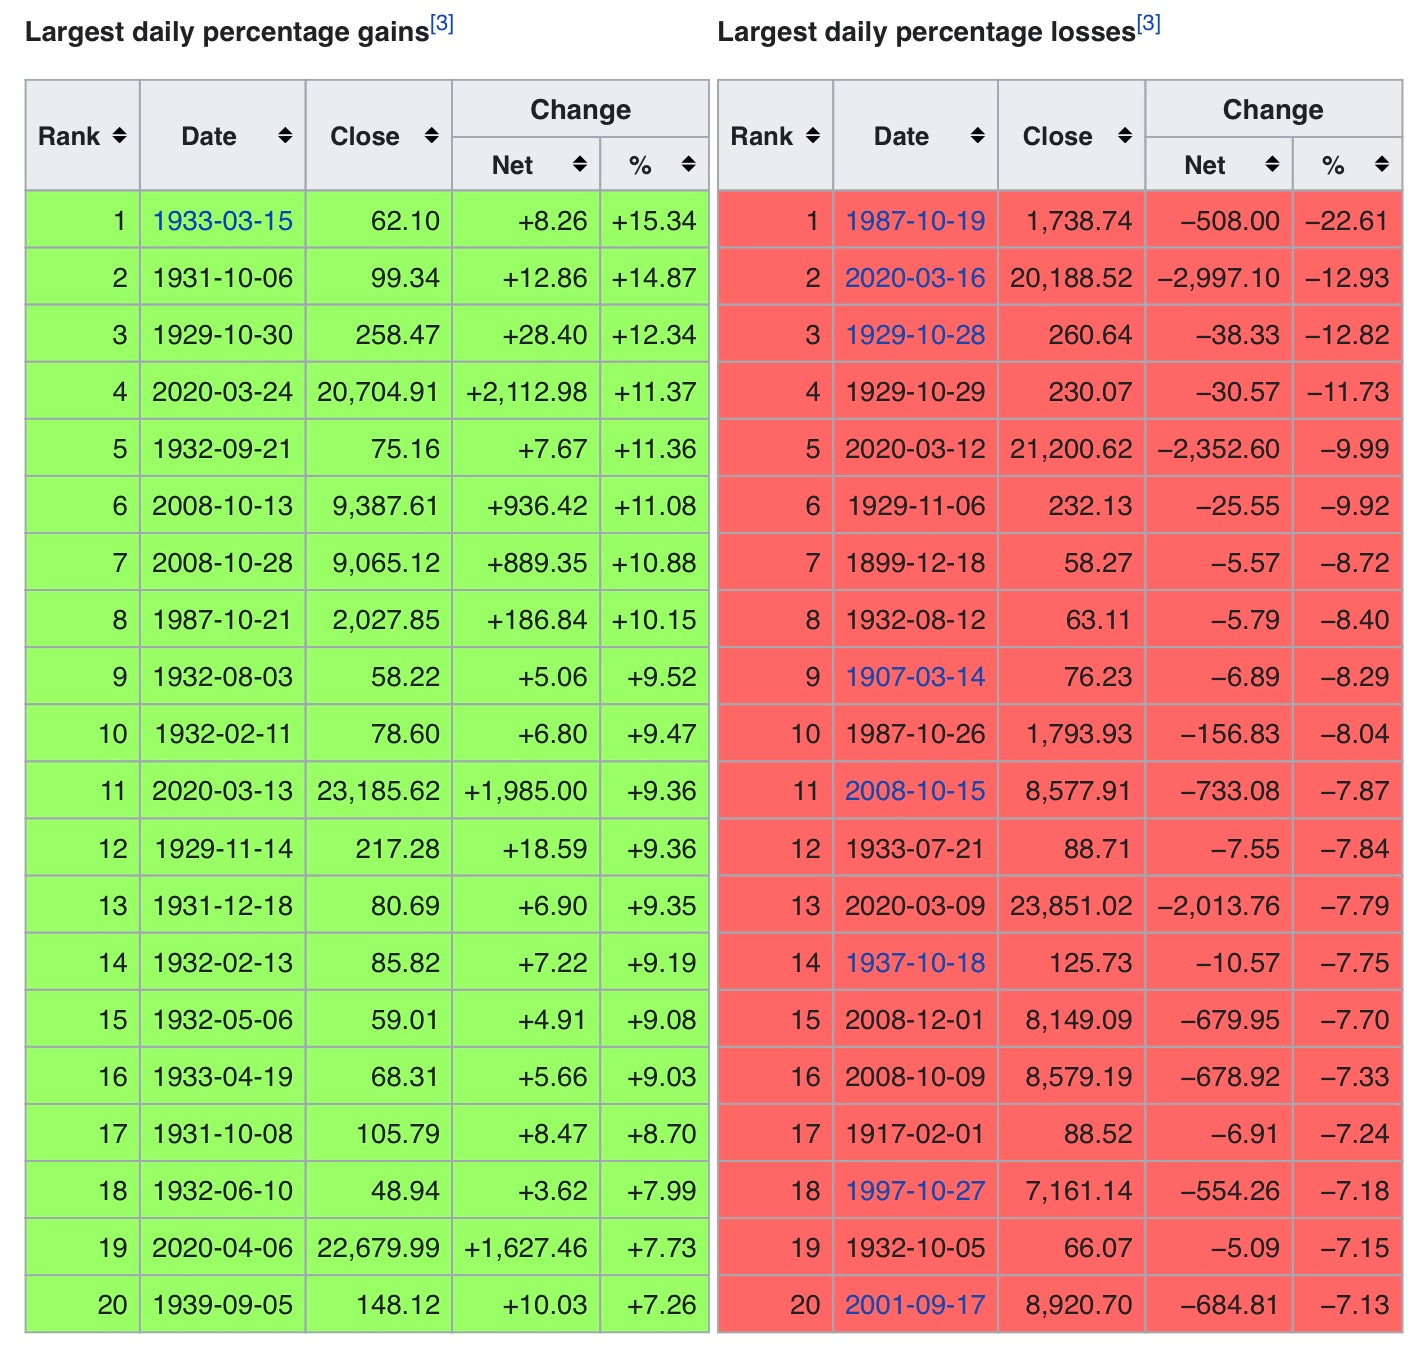
You can see clustering of the best and worst days in the chart. Most of the best and worst days occur during the same months.
It turns out that if you miss the best days AND the worst days, you are probably better off. Sure, it would be great if you could somehow miss only the worst days, but how? I wouldn’t want to attempt that.
Looking back, what you see is that the best days as well as the worst days mostly occur during the worst months.
10 Best Days Rational Thought
Looking at the clustering of the best and worst days, my first question concerning what these “10 Best Days” articles suggest is this - What are the odds you would trade in and out of the market and somehow miss only the best days, but still suffer the worst days? It's certainly possible, however, I think extremely unlikely.
What are the odds you would trade in and out of the market and somehow miss only the best days, but still suffer the worst days? It's certainly possible, however, I think extremely unlikely.
10 Best Days and My FIRE TAA Models
My FIRE tactical asset allocation (TAA) / trend following investing models do not attempt to move in and out of the market on a daily basis. Rather, they work on a monthly basis and most trades are held for multiple months. With this in mind, I decided to see what happened with the stock market and my models for some of the volatile months shown in the chart above.
During my research, I looked at the following months: October 1987, September 2001, October 2008, December 2008, March 2020, and April 2020. Unfortunately, I don’t have access to index data for the other months listed back in the late 1920s and early 1930s. I really wish I did!
Best Days and Worst Months - S&P 500
Let’s see how the S&P 500 performed during these months with the best and worst days. Here are the months we can review, including the market’s returns:
- October 1987, S&P 500 was down 8.19%
- September 2001, S&P 500 was down 8.09%
- October 2008, S&P 500 was down 16.79%
- December 2008, S&P 500 was up 1.07%
- March 2020, S&P 500 was down 12.37%
- April 2020, S&P 500 was up 12.81%
Interesting. Missing the months with the best and worst days appears to work to our advantage most of the time. To be fair, it’s worth mentioning that there was one very good month among the bad months with April of 2020 returning a hefty 12.81%.
Best Days and Worst Months - TSP Model
Next let’s see what my models recommended for these time periods and how they performed. For this exercise, I used one of my basic Thrift Savings Plan (TSP) Models that is either “risk on” in the market using Vanguard’s VFINX S&P 500 index fund (Same as the TSP's C Fund), or “risk off” out of the market using Vanguard’s VBMFX aggregate bond index fund (Same as the TSP's F Fund). My TSP Model follows a similar TAA strategy as my FIRE trend following TAA models.
Here are the months again, adding my TSP model’s performance:
- October 1987, S&P 500 was down 8.19%, model was risk off, up 3.5%
- September 2001, S&P 500 was down 8.09%, model was risk off, up 0.89%
- October 2008, S&P 500 was down 16.79%, model was risk off, down 2.53%
- December 2008, S&P 500 was up 1.07%, model was risk off, up 3.32%
- March 2020, S&P 500 was down 12.37%, model was risk off, up 4.17%
- April 2020, S&P 500 was up 12.81%, model was risk off, up 1.69%
It looks like my TSP model avoided the market’s turmoil through all of these highly volatile months.
Best Days and Worst Months - Entire Trades
Next, I decided to look at the entire trade for each of these time periods to see how long my TSP model was out of the market, how the model performed for the trade, and how the market performed during the same trade time period.
Here are the months one more time with my TSP model’s trades added:
- October 1987, S&P 500 was down 8.19%, model was risk off, up 3.5% - My TSP model traded into risk off bonds from May - December 1987, up 3.88%, S&P 500 was down 12.69% during the same period.
- September 2001, S&P 500 was down 8.09%, model was risk off, up 0.89% - My TSP model traded into risk off bonds from May - December 2001, up 6.62%, S&P 500 was down 7.34% during the same period.
- October 2008, S&P 500 was down 16.79%, model was risk off, down 2.53% - My TSP model traded into risk off bonds from July 2008 - February 2009, up 3.41%, S&P 500 was down 41.46% during the same period.
- December 2008, S&P 500 was up 1.07%, model was risk off, up 3.32% - My TSP model traded into risk off bonds from July 2008 - February 2009, up 3.41%, S&P 500 was down 41.46% during the same period.
- March 2020, S&P 500 was down 12.37%, model was risk off, up 4.17% - My TSP model traded into risk off bonds from March - June 2020, up 7.25%, S&P 500 was up 5.61% during the same period.
- April 2020, S&P 500 was up 12.81%, model was risk off, up 1.69% - My TSP model traded into risk off bonds from March - June 2020, up 7.25%, S&P 500 was up 5.61% during the same period.
The TSP model performed very well. Remember, we’re looking at the actual performance AND looking our ability to “sleep at night” during the market’s highly volatile time periods. Being able to sleep at night is crucial to staying with your investing strategy.
Have I Found a Perfect Investing Model?
Not hardly! Let me be clear, my TSP model (or other FIRE TAA models) isn’t perfect; not even close. While it’s recommendations were spot on for all of these best and worst days/months, it doesn’t always make the best decision.
To give you some perspective for my TSP model, it had 75 trades from January 1987 - September 2020. There were 61 winning trades and 14 losing trades. During those same trade time periods, the S&P 500 was up 54 and down 21.
My TSP model’s five worst losing trades were -8.75%, -8.56%, -5.6%, -4.42%, and -2.39%. During those same five worst trades for my TSP model, the S&P 500 returned -7.25%, -7.84%, -5.7%, -3.38%, and -1.34% respectively.
The five worst trade time periods for the S&P 500 were -41.46%, -12.89%, -12.69%, -7.84%, and -7.34%. During those same five worst trade time periods for the S&P 500, my TSP model returned 3.41%, 5.47%, 3.88%, -8.56%, and 6.62% respectively.
Here is a look at the equity curve for my TSP model versus buying and holding the S&P 500 via Vanguard’s VFINX mutual fund.
Note: I began my research on this last fall, so my chart runs only through September 2020.

That wraps up my review of the stock market’s time periods around the 10 best days as well as the 10 worst days.
Remember I said "Hold that thought" in my first paragraph above. I'm not sure about you yet, so let's flip the question. Ask me if I want to miss the stock market's 10 best days. I will answer "Gladly" every time.
Ask me if I want to miss the stock market’s 10 best days. I will answer “Gladly” every time.
Do you want to miss the market’s 10 best days?
Thanks for reading!
Mike Bishop
Editor, The FIRE Letter
Disclaimer: All strategies including recommended trades published here are for educational and informational purposes only. They are not recommended for any specific individual, business, or other legal entity. I don’t know your age, income, personal or financial circumstances and cannot possibly suggest any financial or investing decisions for you. Seek advice from your accountant, financial advisor, and attorney before making any investing decisions. Always conduct your own due diligence before making any investing decisions. Seriously!